Flow-FL Datasets
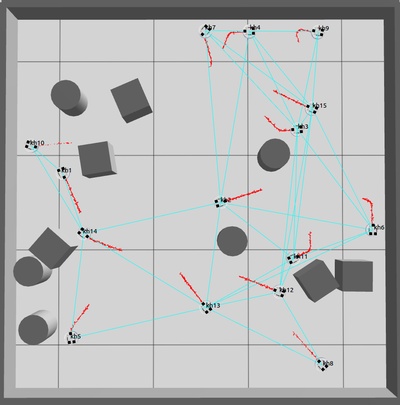
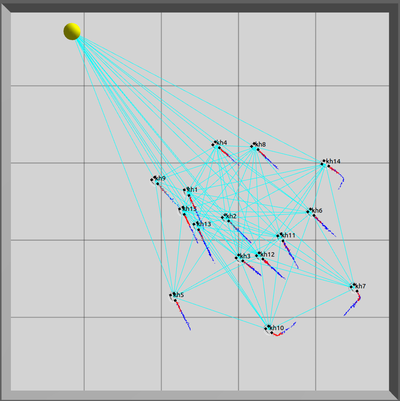
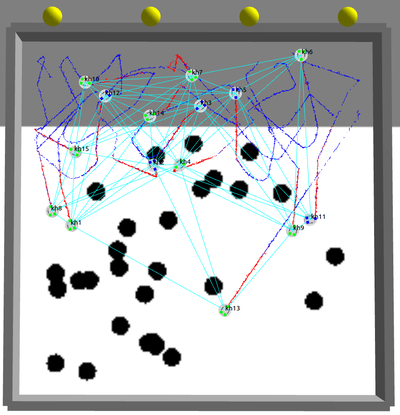
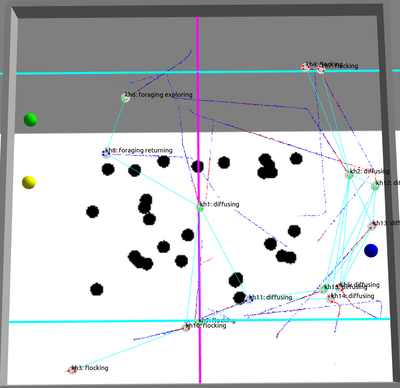
We generated multiple synthetic datasets of swarm motion across four distinct behaviors (diffusion with avoidance, flocking, foraging and, mixed behaviors) using ARGoS, a realistic physics-based simulator. Each behavior dataset consists of:
- A trajectory file that records the robot's id, neighbor id, and position across time
(robot id, neighbor id, t, x, y, z). Each robot records neighbor trajectories for 50,000 time steps (5,000 s). A trajectory sample, within a setup, is 100 time steps (10 s) long and is separated from other samples by an end-of-line character. Each trajectory is expressed in the local reference frame of the robot at the start of the sample recording. This is a fixed frame of reference independent of subsequent robot motion. This removes the effect of the motion of the robot itself. - A communication graph file, structured as
(t, robot id, neighbor id), that logs information about the neighboring robot IDs that are in range at every time step. This information encodes the communication graph at every time step. The communication graph file is more complete than the trajectory file because when recording the trajectory file, we drop interrupted trajectories.
They can be found here: Dataset files
The table here below provides the total number of samples in each dataset as well as statistics about the distribution of samples between robots. The table reveals diversity across the behaviors in the number of samples collected, both total and per robot, also considering total time and 10-minute windows. In particular, the standard deviation shows how different behaviors result is different levels of imbalance in the number of samples collected by the robots.
| Dataset | Robots | Samples | Samples/robot | Samples/robot /10 min | ||
|---|---|---|---|---|---|---|
| Mean | Stdev | Mean | Stdev | |||
| Avoidance | 15 | 21227 | 1415 | 206 | 169 | 40 |
| 60 | 216582 | 3610 | 397 | 429 | 74 | |
| Flocking | 15 | 49009 | 3267 | 427 | 390 | 78 |
| 60 | 333111 | 5552 | 436 | 659 | 112 | |
| Foraging | 15 | 35854 | 2390 | 46 | 284 | 19 |
| 60 | 187304 | 3122 | 65 | 371 | 25 | |
| Mixed | 15 | 30627 | 2042 | 290 | 242 | 66 |
| 60 | 174863 | 2914 | 89 | 346 | 29 | |
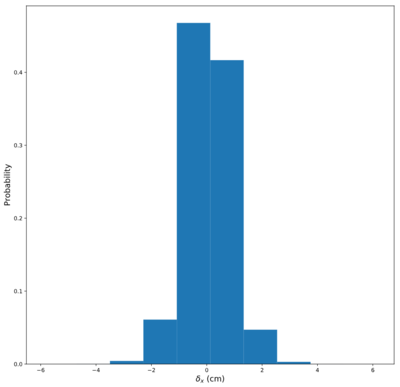
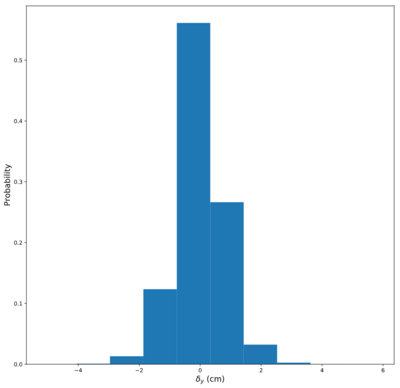
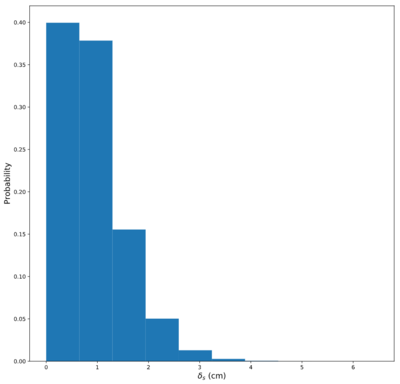
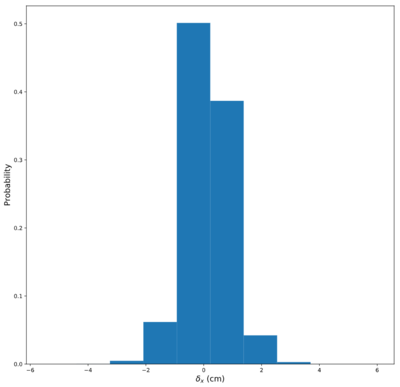
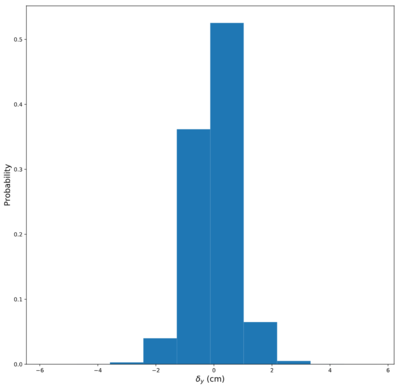
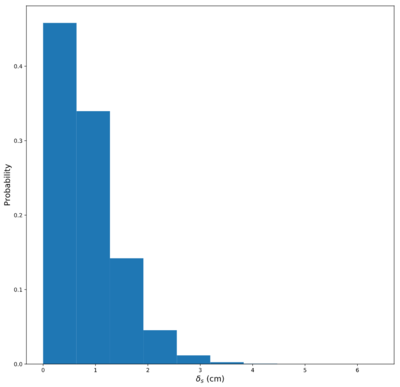
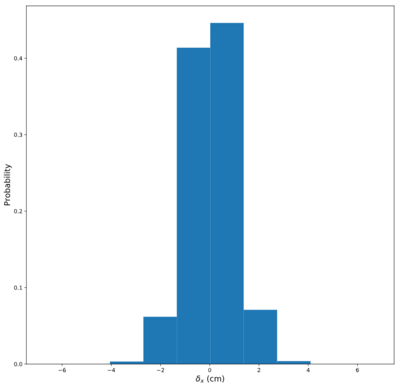
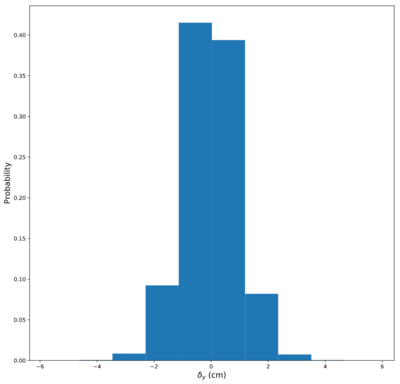
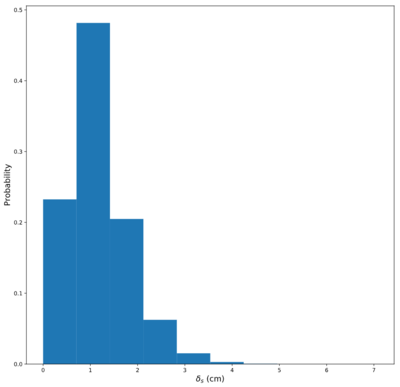
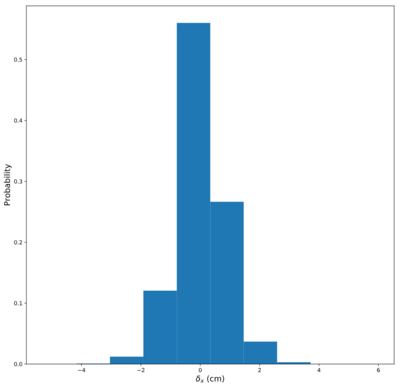
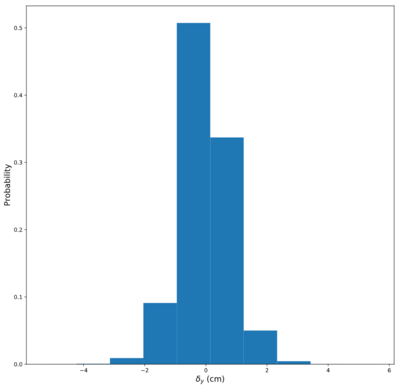
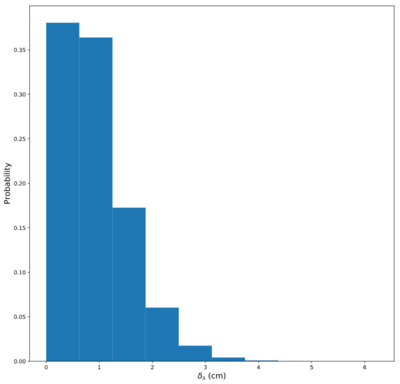
For each behavior, we include videos of the corresponding simulation in the following sections. We also plot the histograms of the x-, y- , and euclidean offsets to explore the change in x- and y- positions from the previous time step. This shows whether robots are more likely to remain stationary (e.g. when turning in place) or have incremental positional changes (within 0.5 cm). We also note that the distributions for each of the behaviors explored are different.
1. Diffusion with obstacle avoidance
The first considered behavior is obstacle-avoidance in a dense environment with uniformly distributed static obstacles:
Simulation with 15 robots:
Simulation with 60 robots:
Histogram of x-, y- , and euclidean offsets with 15 robots:
2. Flocking towards a light source
In the second behavior, robots perform phototaxis and flocking based on artificial physics, with a light whose position is changed to prevent stagnation:
Simulation with 15 robots:
Simulation with 60 robots:
Histogram of x-, y- , and euclidean offsets with 15 robots:
3. Foraging
In the third behavior, robots are foraging for resources and decide whether to explore or stay in the nest according to energy considerations:
Simulation with 15 robots:
Simulation with 60 robots:
Histogram of x-, y- , and euclidean offsets with 15 robots:
4. Mixed
The fourth behavior is a mixed behavior in which robots perform one of the previous behaviors depending on their location in the environment:
Simulation with 15 robots:
Simulation with 60 robots:
Histogram of x-, y- , and euclidean offsets with 15 robots:
Contact and Associated Paper
For further details, see our paper : Majcherczyk, N., Srishankar, N., & Pinciroli, C. (2020). Flow-FL: Data-Driven Federated Learning for Spatio-Temporal Predictions in Multi-Robot Systems. arXiv preprint arXiv:2010.08595.
For questions about the dataset, please email info@nestlab.net.
